top of page

Data visualization and data animations
LPJ-PROSAIL
Global spectroscopy data "cubes"

Front image: RGB
R: 660 nm
G: 540 nm
B: 440 nm

Front image: 550 nm
Global spectroscopy data animations

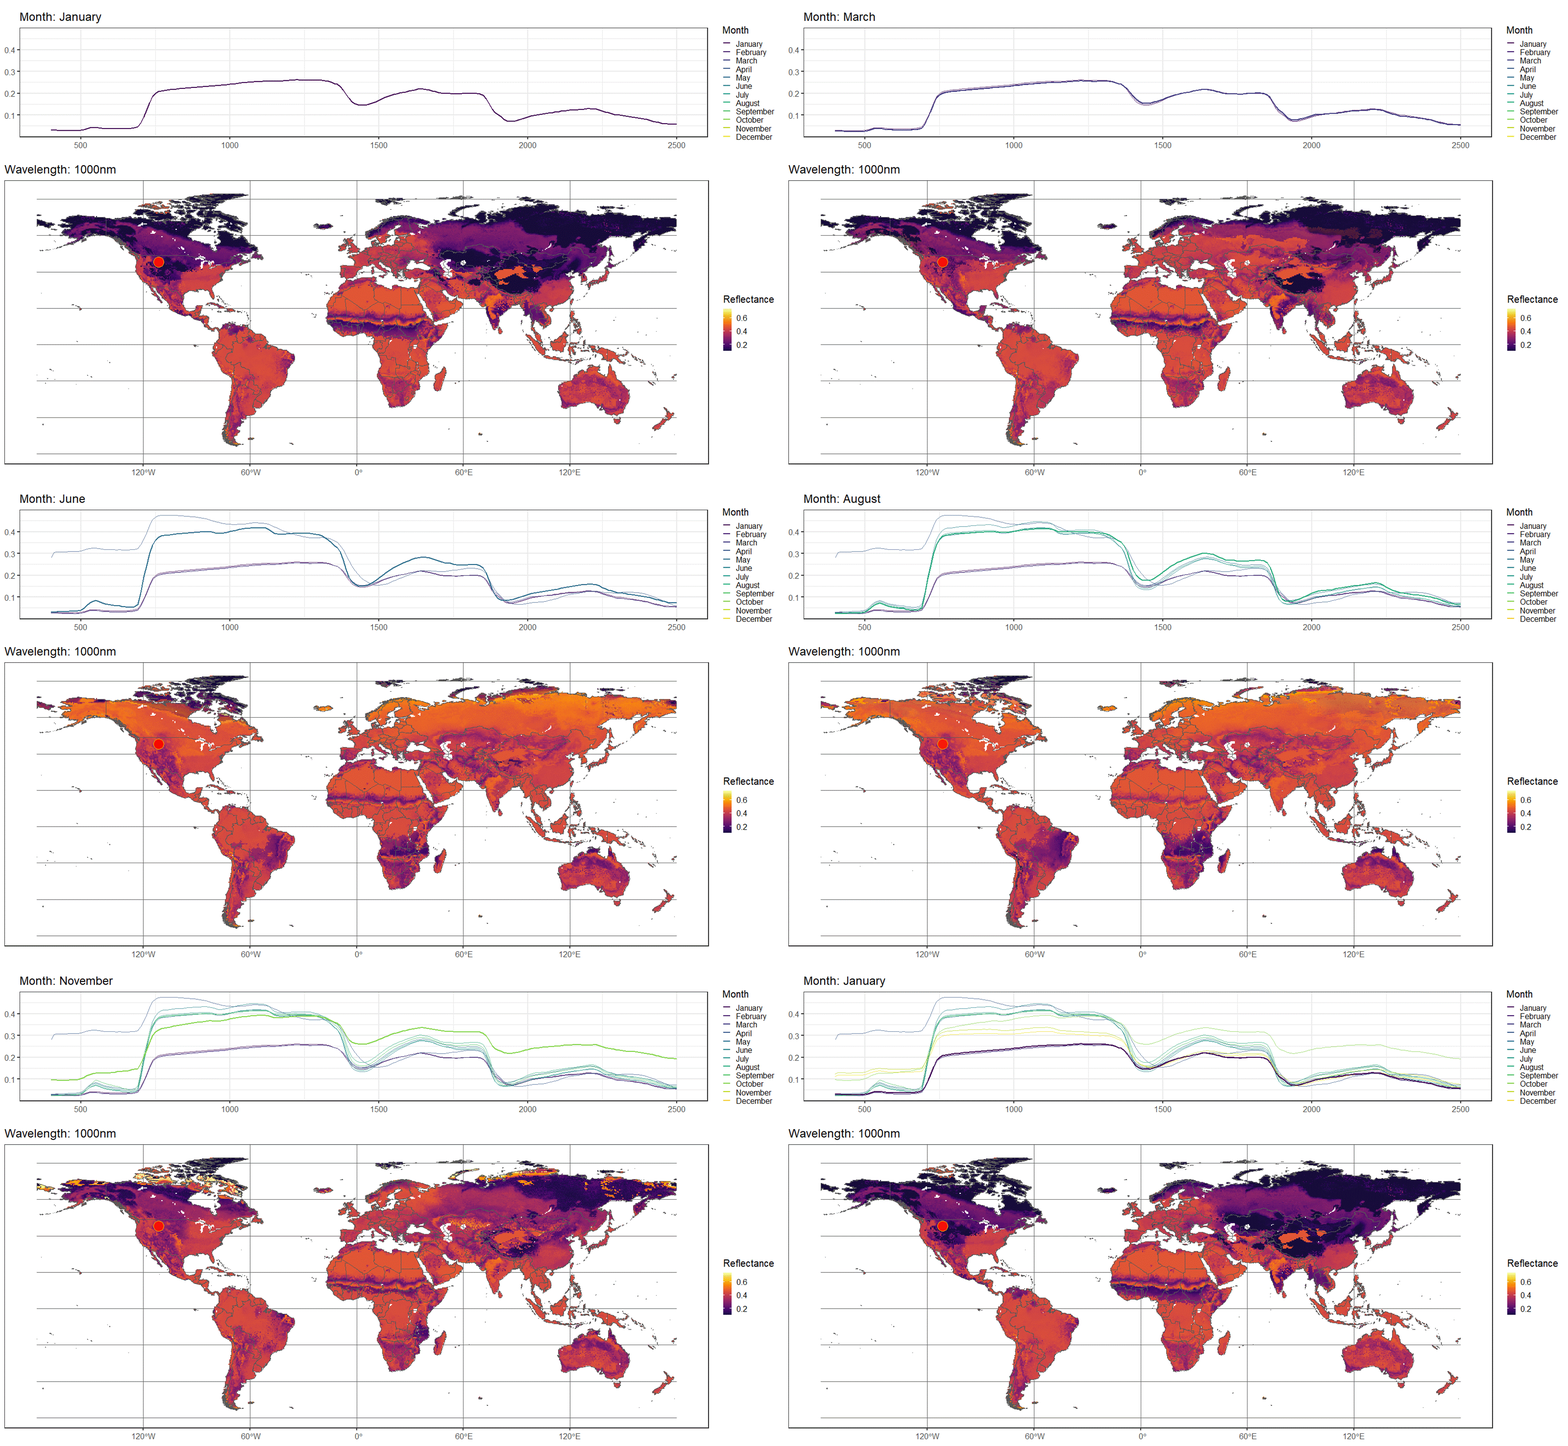
Animation of simulated global spectroscopy data for each wavelength for the month of July. Top animation is for a single pixel in Montana.

Animation of simulated global spectroscopy data for each month, at a fixed wavelength of 1000 nm. Top animation is for a single pixel in Montana.
bottom of page